
Turn Data into Stunning Visuals with Graphy: The Free AI Graph Maker
MarketingDescription
Graphy enables anyone to become a skilled data storyteller, by radically simplifying the way data is presented and communicated.
Website Preview
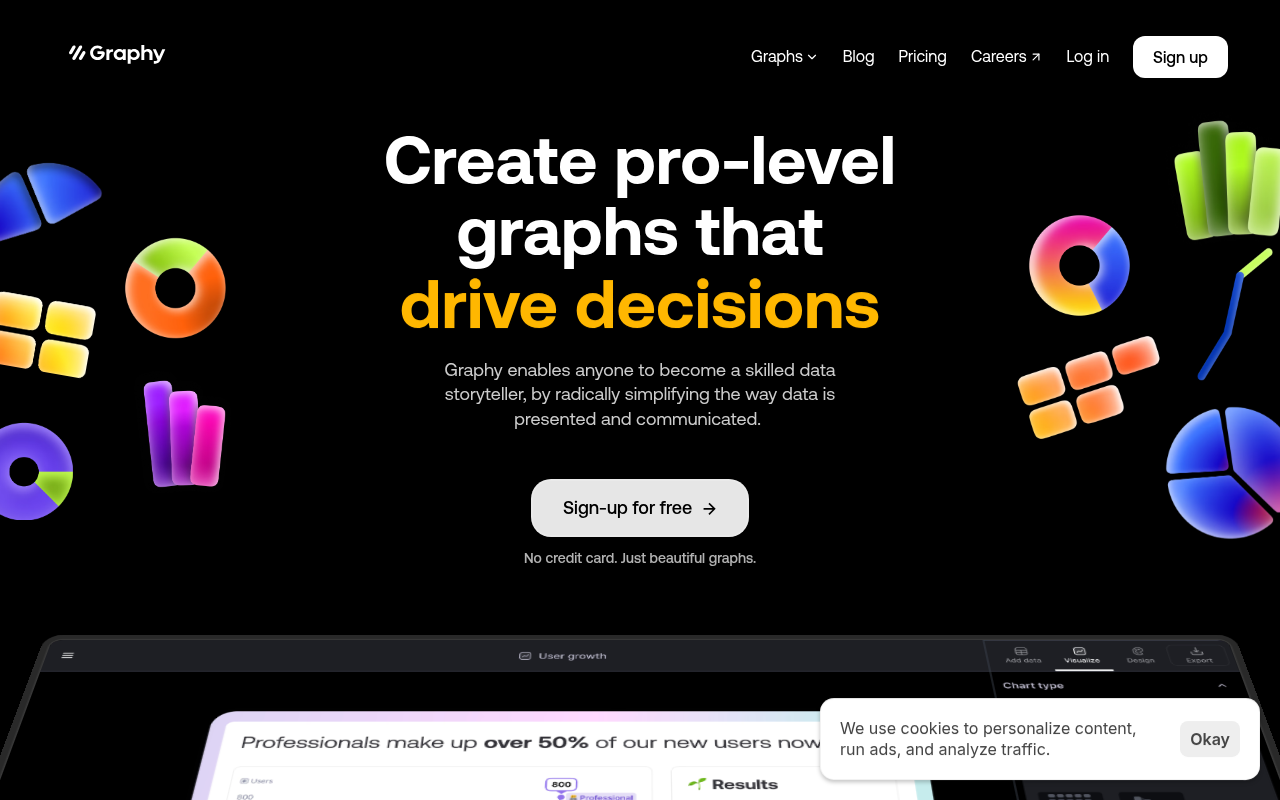
Click to view full size
About This Website
What is Graphy?
Graphy is an AI-powered online tool designed to simplify data visualization and communication. It allows users to create beautiful, engaging graphs and charts without requiring advanced design skills. The platform's purpose is to democratize data storytelling, enabling anyone to present data in a clear, compelling, and visually appealing manner. Graphy leverages AI to automate design choices, suggest optimal chart types, and enhance the overall aesthetic of data presentations. Its target users range from students and educators to business professionals and data journalists – anyone who needs to present data effectively. As a web-based tool, Graphy offers cross-platform accessibility, working seamlessly on various operating systems and devices with only a browser, and offering direct export functionalities.
Key Features
- AI-Powered Chart Suggestions: Graphy analyzes your data and automatically recommends the most appropriate chart types to visualize it effectively. This eliminates the guesswork and ensures that the chosen visualization is optimal for the data being presented.
- Customizable Templates: A library of pre-designed templates offers a starting point for creating professional-looking graphs quickly. These templates are fully customizable, allowing users to tailor the design to their specific needs and branding guidelines.
- Data Import & Integration: Graphy supports importing data from various sources, including CSV files, spreadsheets, and direct integrations with other platforms. This streamlines the data visualization process.
- Real-Time Collaboration: Enables teams to work together on graphs simultaneously, fostering collaboration and ensuring consistency across data presentations.
Pros & Cons
| Pros | Cons |
|---|---|
| ✓ Intuitive and easy-to-use interface | ✗ Limited advanced customization options |
| ✓ Wide variety of chart types and templates | ✗ Internet access is required |
| ✓ AI-powered chart suggestions save time | ✗ Data privacy concerns with cloud storage |
| ✓ Free plan available |
Who is Using Graphy?
Typical users of Graphy include students creating presentations for school, marketers visualizing campaign performance, and business analysts presenting key metrics to stakeholders. Creative use cases involve journalists using Graphy to create interactive data visualizations for online articles, or non-profit organizations using it to illustrate the impact of their programs in visually engaging reports.
Pricing
Graphy offers a tiered pricing structure:
- Free Plan: Provides access to basic features and a limited number of charts.
- Pro Plan: Offers unlimited charts, advanced features, and priority support.
- Team Plan: Designed for collaborative teams, with features like shared workspaces and team-based access control.
Disclaimer: Pricing is subject to change. Please refer to the Graphy website for the most up-to-date information.
What Makes Graphy Unique?
Graphy's unique selling point lies in its AI-powered approach to data visualization. Unlike traditional graph makers that require users to manually select and customize chart types, Graphy intelligently suggests the best visualizations based on the data provided. This saves time, reduces the learning curve, and ensures that users create effective and visually appealing graphs, even without prior design experience. Its real-time collaboration features and focus on simplifying data storytelling also set it apart from other graph-making tools.
How We Rated It
| Category | Rating (1-5) |
|---|---|
| Accuracy and Reliability | 4 |
| Ease of Use | 5 |
| Functionality and Features | 4 |
| Performance and Speed | 4 |
| Customization and Flexibility | 3 |
| Data Privacy and Security | 3 |
| Support and Resources | 4 |
| Cost-Efficiency | 5 |
| Integration Capabilities | 3 |
| Overall Score | 4 |
Summary
Graphy is an excellent AI-powered tool for anyone who wants to create effective and visually appealing graphs without needing advanced design skills. It particularly benefits those who frequently present data and seek a user-friendly platform that streamlines the visualization process. Its intuitive interface and AI-driven features make it a standout choice in the crowded field of data visualization tools.
Similar Tools
The Chosen AI Headshot Generator for realistic professional AI headshots in 4k q...
WorldPress is a platform that simplifies the process of creating and distributin...
Starbuzz is an influencer marketing platform that enables brands to save 50% of ...
Discover Charlie Lounge: Your all-in-one AI platform to automate tasks, boost bu...
Featured Links
Unlock back-tested predictive leading trading indicators on real-time charts. Tr...